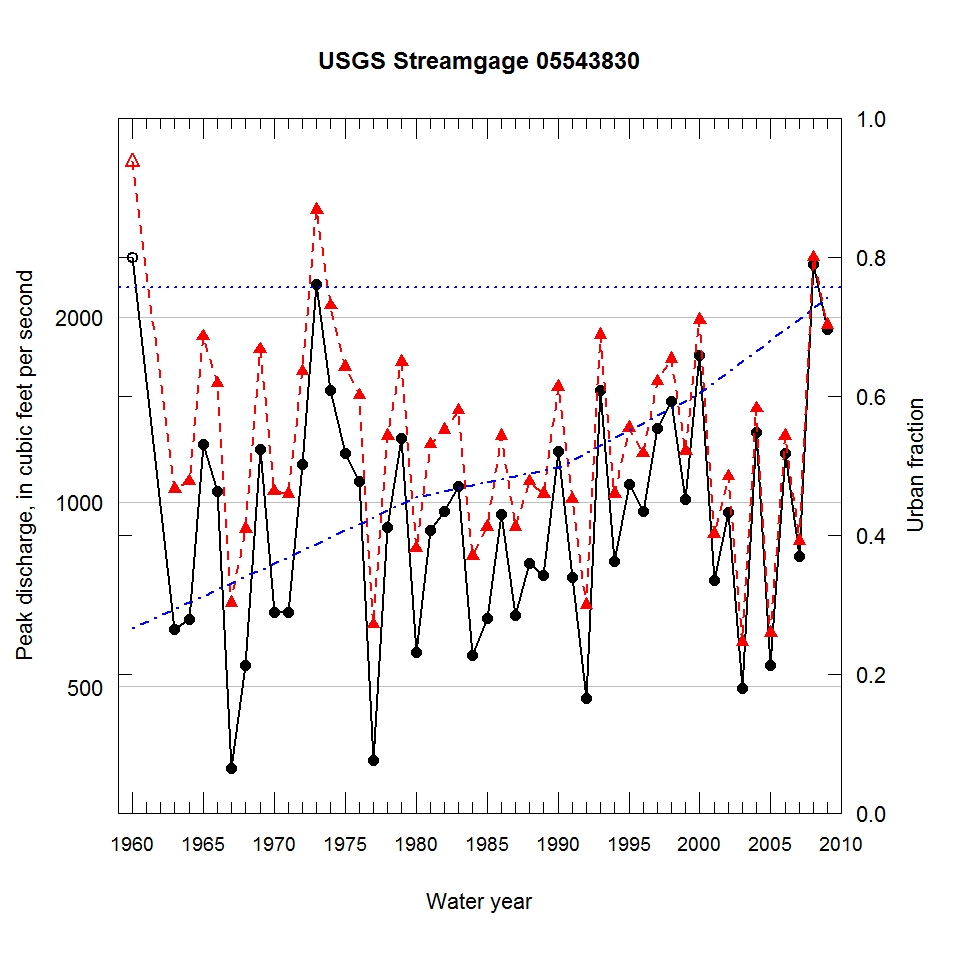
Observed and urbanization-adjusted annual maximum peak discharge and associated urban fraction and precipitation values at USGS streamgage:
05543830 FOX RIVER AT WAUKESHA, WI


| Water year | Segment | Discharge code | Cumulative reservoir storage (acre-feet) | Urban fraction | Precipitation (inches) | Observed peak discharge (ft3/s) | Adjusted peak discharge (ft3/s) | Exceedance probability |
| 1960 | 1 | 7 | 37030 | 0.266 | 1.092 | 2500 | 3580 | 0.013 |
| 1963 | 1 | -- | 37030 | 0.293 | 0.440 | 620 | 1050 | 0.553 |
| 1964 | 1 | -- | 37030 | 0.303 | 1.290 | 644 | 1080 | 0.531 |
| 1965 | 1 | -- | 37030 | 0.312 | 0.949 | 1240 | 1860 | 0.118 |
| 1966 | 1 | -- | 37030 | 0.321 | 0.720 | 1040 | 1560 | 0.197 |
| 1967 | 1 | -- | 37030 | 0.331 | 1.571 | 369 | 685 | 0.859 |
| 1968 | 1 | -- | 37030 | 0.340 | 0.996 | 542 | 904 | 0.686 |
| 1969 | 1 | -- | 37260 | 0.349 | 2.134 | 1220 | 1770 | 0.140 |
| 1970 | 1 | -- | 37260 | 0.358 | 1.815 | 660 | 1040 | 0.562 |
| 1971 | 1 | -- | 37260 | 0.368 | 0.169 | 660 | 1030 | 0.571 |
| 1972 | 1 | -- | 37260 | 0.378 | 2.880 | 1150 | 1630 | 0.177 |
| 1973 | 1 | -- | 37260 | 0.387 | 3.214 | 2260 | 2990 | 0.020 |
| 1974 | 1 | -- | 37260 | 0.397 | 0.708 | 1520 | 2090 | 0.075 |
| 1975 | 1 | -- | 37260 | 0.406 | 0.740 | 1200 | 1660 | 0.170 |
| 1976 | 1 | -- | 37260 | 0.416 | 1.835 | 1080 | 1490 | 0.229 |
| 1977 | 1 | -- | 37260 | 0.425 | 0.374 | 379 | 632 | 0.894 |
| 1978 | 1 | -- | 37260 | 0.435 | 1.905 | 910 | 1280 | 0.370 |
| 1979 | 1 | -- | 37260 | 0.444 | 0.332 | 1270 | 1690 | 0.161 |
| 1980 | 1 | -- | 37260 | 0.454 | 1.205 | 569 | 840 | 0.744 |
| 1981 | 1 | -- | 37260 | 0.458 | 0.756 | 900 | 1240 | 0.400 |
| 1982 | 1 | -- | 37260 | 0.462 | 1.474 | 965 | 1310 | 0.346 |
| 1983 | 1 | -- | 37260 | 0.467 | 1.297 | 1060 | 1410 | 0.275 |
| 1984 | 1 | -- | 37260 | 0.471 | 0.260 | 562 | 816 | 0.762 |
| 1985 | 1 | -- | 37260 | 0.475 | 0.423 | 646 | 911 | 0.680 |
| 1986 | 1 | -- | 37260 | 0.480 | 1.450 | 955 | 1280 | 0.370 |
| 1987 | 1 | -- | 37260 | 0.484 | 1.964 | 653 | 911 | 0.680 |
| 1988 | 1 | -- | 37260 | 0.488 | 0.168 | 793 | 1080 | 0.533 |
| 1989 | 1 | -- | 37260 | 0.492 | 0.394 | 759 | 1030 | 0.574 |
| 1990 | 1 | -- | 37260 | 0.497 | 1.083 | 1210 | 1540 | 0.206 |
| 1991 | 1 | -- | 37260 | 0.507 | 0.760 | 755 | 1010 | 0.592 |
| 1992 | 1 | -- | 37260 | 0.518 | 0.501 | 479 | 679 | 0.864 |
| 1993 | 1 | -- | 37260 | 0.529 | 2.001 | 1520 | 1870 | 0.116 |
| 1994 | 1 | -- | 37260 | 0.539 | 1.770 | 800 | 1030 | 0.575 |
| 1995 | 1 | -- | 37260 | 0.550 | 2.667 | 1070 | 1320 | 0.335 |
| 1996 | 1 | -- | 37260 | 0.561 | 1.994 | 967 | 1200 | 0.434 |
| 1997 | 1 | -- | 37260 | 0.572 | 3.511 | 1320 | 1570 | 0.197 |
| 1998 | 1 | -- | 37260 | 0.582 | 1.939 | 1460 | 1710 | 0.156 |
| 1999 | 1 | -- | 37260 | 0.593 | 1.953 | 1010 | 1210 | 0.427 |
| 2000 | 1 | -- | 37260 | 0.604 | 3.989 | 1730 | 1980 | 0.092 |
| 2001 | 1 | -- | 37260 | 0.619 | 2.270 | 746 | 886 | 0.706 |
| 2002 | 1 | -- | 37260 | 0.634 | 4.407 | 963 | 1100 | 0.509 |
| 2003 | 1 | -- | 37260 | 0.649 | 0.805 | 497 | 592 | 0.918 |
| 2004 | 1 | -- | 37260 | 0.665 | 2.564 | 1300 | 1420 | 0.266 |
| 2005 | 1 | -- | 37260 | 0.680 | 0.377 | 542 | 612 | 0.907 |
| 2006 | 1 | -- | 37260 | 0.695 | 1.636 | 1200 | 1280 | 0.369 |
| 2007 | 1 | -- | 37260 | 0.711 | 1.347 | 815 | 864 | 0.724 |
| 2008 | 1 | -- | 37260 | 0.726 | 2.249 | 2440 | 2500 | 0.040 |
| 2009 | 1 | -- | 37260 | 0.741 | 2.774 | 1910 | 1940 | 0.100 |

